
What is historical volatility?
Historical volatility can be defined as the average deviation (dispersion) of a security or market index from its average price.
Historical volatility is also referred to as a stock’s actual or realized volatility. It measures the fluctuations in the price of a security or stock market index over a specified time period and it reflects the price movements of the past.
It is used to gauge the risk of a stock or index in order to better predict future price fluctuations or expected returns. Historical volatility is not only calculated for specific security (stock or bond) but it is also used to calculate the fluctuations of an index (S&P 500, DJIA, Shanghai stock market index, etc.) over a specific period.
How historical volatility works
Historical volatility shows the magnitude and frequency of increase or decrease in a stock’s price by calculating the standard deviation of the returns. It indicates the fluctuations or the movement in the price by looking at how farther is the increase or decrease in price from the average price. Therefore, it provides valuable information about the riskiness of an asset based on its past performance.
Although past performance does not guarantee future performance, traders and investors can use historical volatility to analyze how a certain asset could behave within their portfolio. It is also used to determine risk and to estimate expected returns.
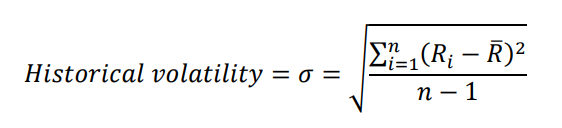
Historical volatility formula
Historical volatility is calculated as the standard deviation of the returns of a stock or index indicated as:
Here are the steps to calculate the historical volatility from the daily closing price of a stock or index:
1. Calculate the return
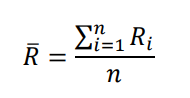
2. Calculate the average return
3. Calculate the squared deviation from the average for each of the returns

4. Calculate the variance

5. Calculate standard deviation (Square root of the variance)

Where:
σ is the 1-day historical volatility.
In order to convert it to annualized historical volatility, we multiply σ by the square root of the number of trading days in a year.
Example
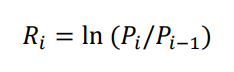
Historical volatility is calculated as a standard deviation of a security or market index’s return over a fixed period. Hence, in order to calculate the historical volatility, we first calculate the stock’s return by taking the logarithm of the closing prices of an asset.
1. Calculate the logarithmic returns
Let’s consider a stock with the following returns over a 10-day period:
| Tradings days | Logarithmic returns |
| 1st day | 0.5% |
| 2nd day | -0.2% |
| 3rd day | 0.3% |
| 4th day | 0.1% |
| 5th day | 0.3% |
| 6th day | 0.4% |
| 7th day | 0.5% |
| 8th day | -0.8% |
| 9th day | 0.6% |
| 10th day | 0.7% |
We suppose that a stock’s logarithmic returns over a period of ten days are 0.5,-0.2,0.3,0.1,- 0.3,0.4,0.5,-0.8,0.6,0.7.
2. Calculate the average return
We calculate the average return by adding all the returns and dividing it by the returns.
Average return= (0.5+-0.2+0.3+0.1+-0.3+0.4+0.5+-0.8+0.6+0.7)/10
Average return= 1.8/10
Average return= 0.18
3. Calculate the squared deviation (G)
In order to calculate the squared deviation, we subtract the average return calculated above from the daily return and then square it.

4. Calculate the standard deviation

Example using excel
Suppose we have stock returns of 0.4,0.7,0.8,0.3, -0.1 for five days. We simply calculate the standard deviation of these returns by putting =STDEV.P(return1, return2,) in the formula bar. The calculated standard deviation is the historical volatility of the stock - 0.32 in this case.
What is low historical volatility?
Low historical volatility for an asset or market index is observed when the price of the security remains relatively stable and the ups and downs in the price of the stock are small and infrequent. Historical volatility lower than 50% is often considered low, which indicates that the stock or asset is less risky.
What is high historical volatility?
A historical volatility figure above 50% is often considered high and it indicates that a security or market index fluctuates more frequently and there are higher ups and downs in the price. The increases or decreases in the price of the stock around the average price are higher and the decrease and increase happen more often. Resultantly, the stock becomes riskier and the investors require a higher rate of return for the asset to justify the risk involved in investing in it.
What is a good number for historical volatility?
Based on the volatility of the different market indices 10% is considered to be low volatility, while 80% and above volatility would be quite higher. The volatility value also depends on the risk tolerance of an investor.
What historical volatility tells investors?
Risk and return go hand in hand. Higher historical volatility indicates that the stock is risky and there is a larger increase and decrease in the price. Because of these frequent larger fluctuations in the price the investors expect higher returns from that stock.
Based on the higher historical volatility the required rate of return and options premiums rise due to the increased risk investors expect to bear in the market. Therefore, stocks with higher historical volatility are recommended for investors whose risk tolerance is higher and are expected to achieve higher returns.
Conversely, risk-averse investors with low-risk tolerance are suggested to invest in safer assets with lower historical volatility. Although, stocks having higher historical volatility has the potential for higher profits during rapid increases but they can also result in huge losses during sudden dramatic falls and are therefore not recommended for investors with lower risk tolerance.