Looking at different indicators of current valuations, the conclusion is the same, we are heading for a market correction. The level of the market at this point can only rival what we witnessed in the dot com bubble.
S&P 500 P/E Ratio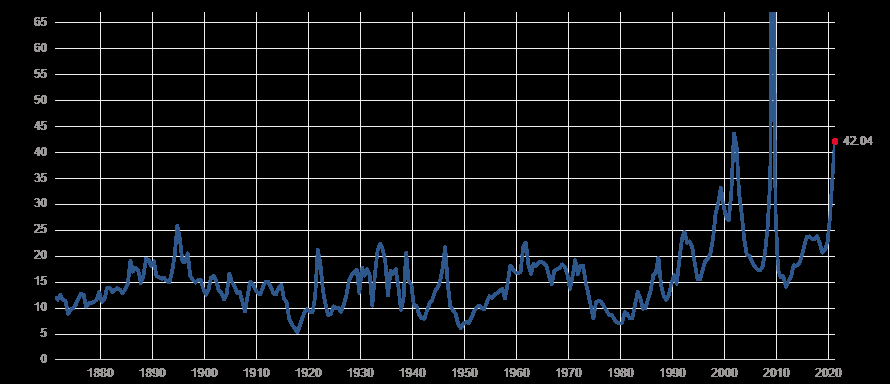
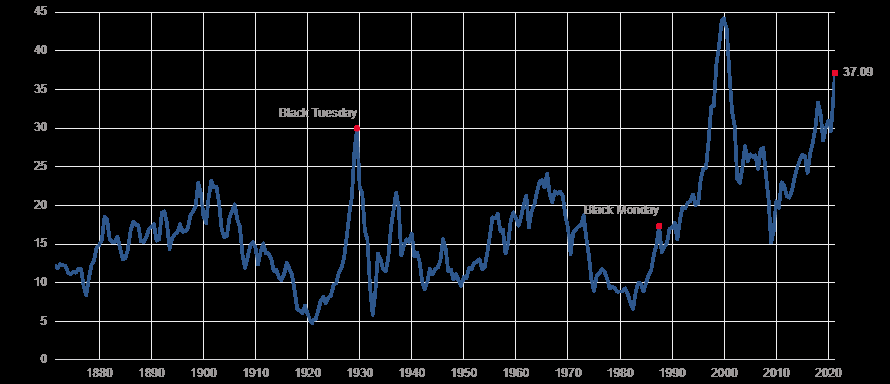
The Shiller P/E ratio also points us to the same conclusion, the market is clearly overvalued. The level of optimism is so high, that a little bad news could send the stock market collapsing. When all the good news is priced in, look out for the downside. The same could be said about individual companies.
Shiller P/E Ratio
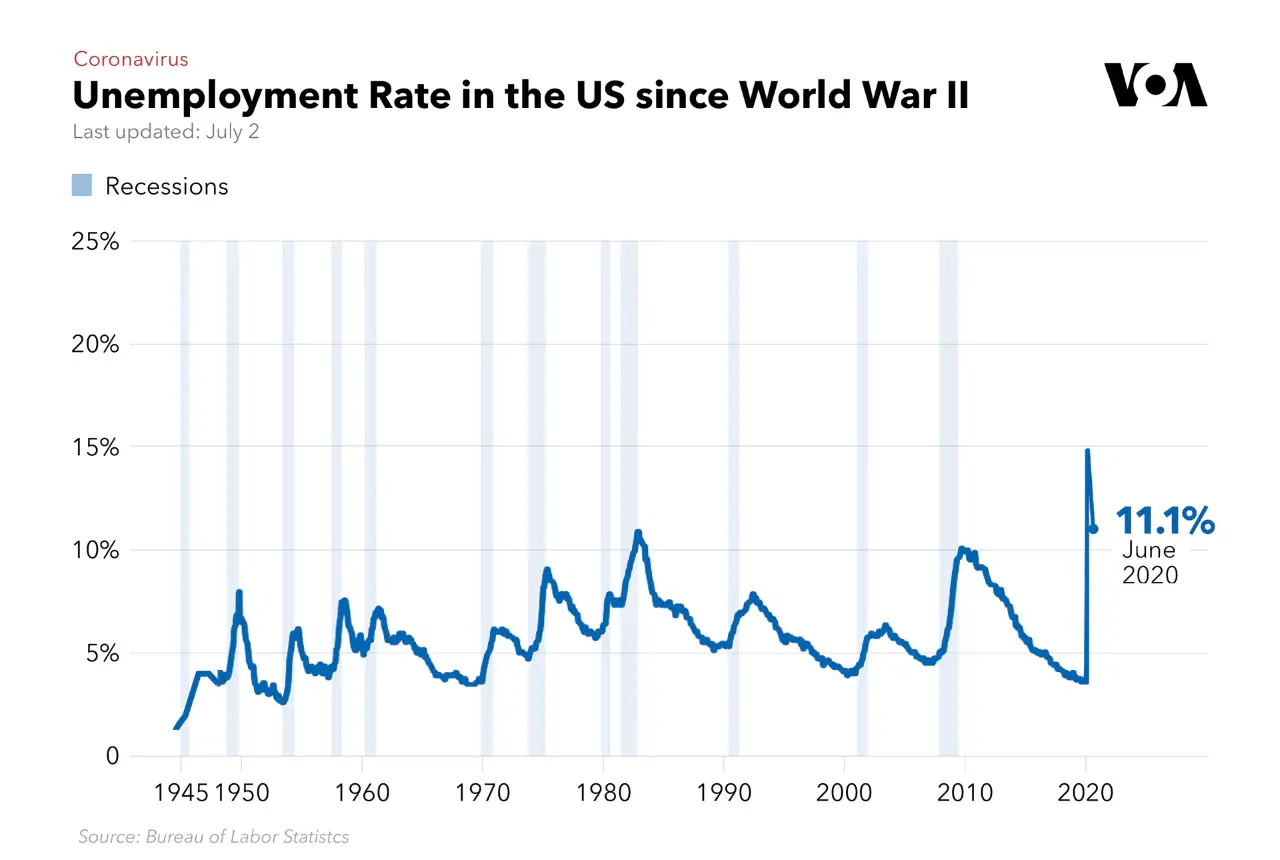
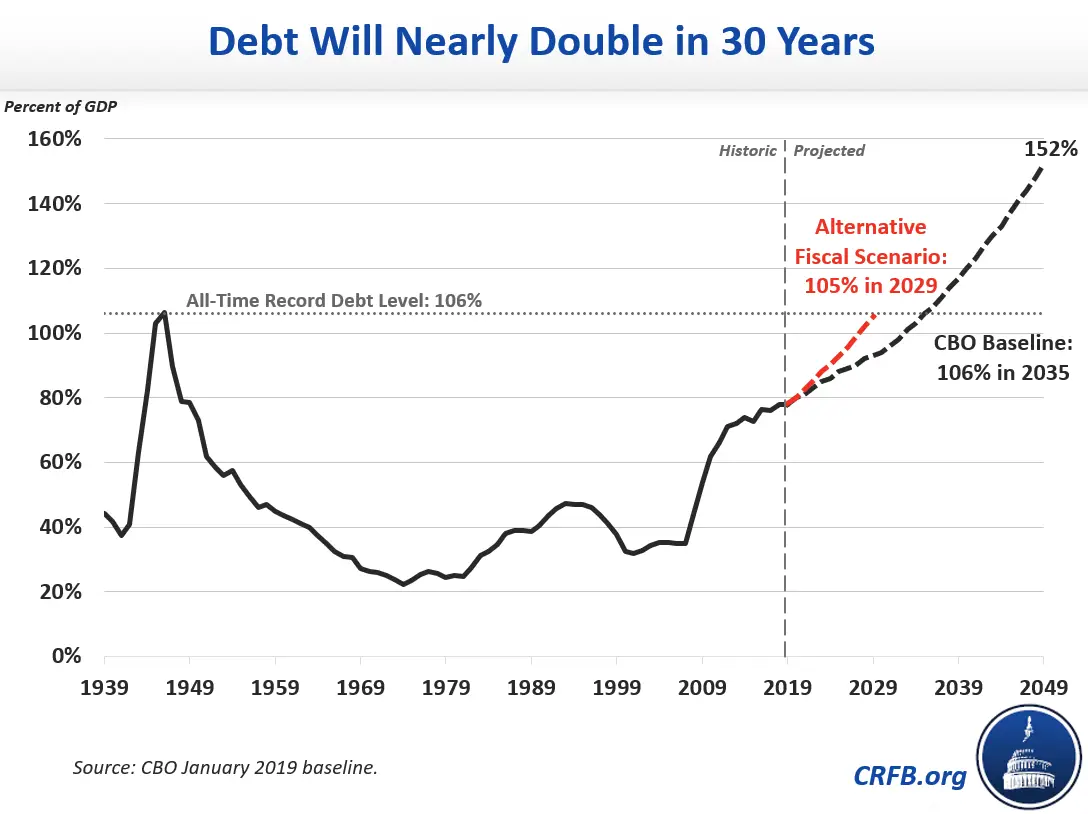
Despite the fact that both indicators are not as high as the dot com bubble, we should consider other factors. The underlying economy was in a much better shape. Several economic indicators show just that. Unemployment is now much higher than it was at the turn of the century, and so is the Debt-to-GDP which has been surging at a fast pace. Debt-to-GDP projections for the next three decades also show a terrifying picture.
 Often regarded as the Buffett indicator, the stock market capitalization-to-GDP is another ratio that could signal the extreme folly present in the market. This is Buffett's main indicator for a market correction. At the highest level, it has ever been, there is no more clear sign that the market is due for a steep correction at some point this year or the next.
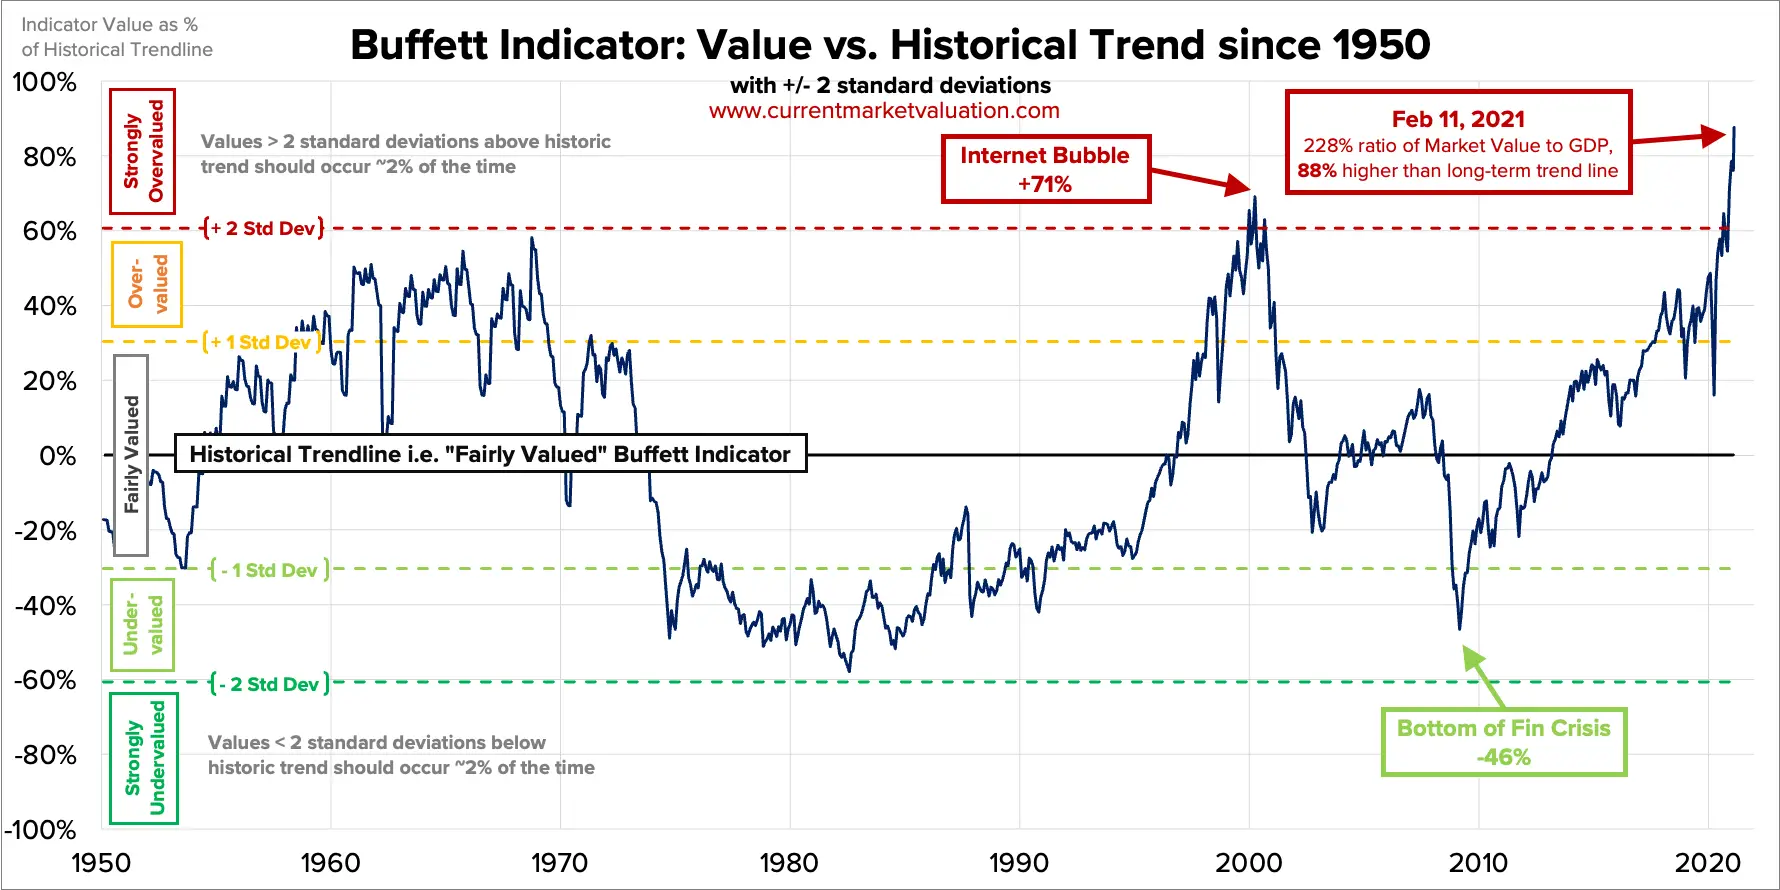 Source: Visual Capitalist
Combining all the factors, it is clear to see how we could see more volatility ahead. If you thought that this was enough for you to suddenly turn into a bear, let’s see some more bearish indicators
Excessive Margin Leads To a Market Correction
Never before have we reached the level of margin that we now have. We get it, after March 2020, and due to the lockdowns, millions of bored individuals took their lockdown frustrations to the stock market. Making erratic bets, and yoloing on options. The fact that is often dismissed is the increased amount of margin borrowing that has taken place since COVID-19 started. This poses a major threat to investors across the board. From passive to active. The problem here is the fact that all these factors greatly increase the systematic risk of a total meltdown.
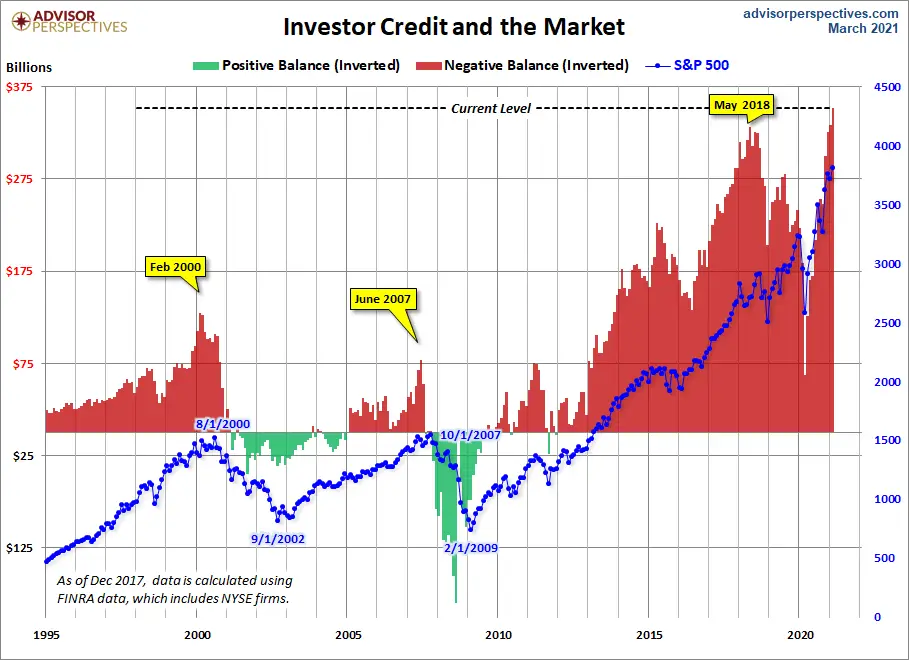 Source: Advisor Perspectives
The recent collapse of Archegos Capital shows the fragility of the entire system. How a little family office blowing up can shake the entire financial system. Let’s not forget that over 20 years ago, LTCM imploded and was close to bringing down the entire market stability with it.
Put/Call Ratio
Although this indicator should not be used to make stock market predictions. It strikes me as an interesting coincidence that the put/call ratio is at its lowest in five years. This simply reinstated the extreme bullishness of the market overall, and as a contrarian, it signals that there might be value in being short.
The put/call ratio has been in a steep decline after the March 2020 crash. Sinking to its six-year low in June of 2020, and reaching a twenty-year low of 0.39 in September 2020. This year, it has reached even lower levels, 0.34 on the 13th of January, and nearly retested that low on the 24th of February reaching 0.35. Since then it has climbed back up to 0.5.
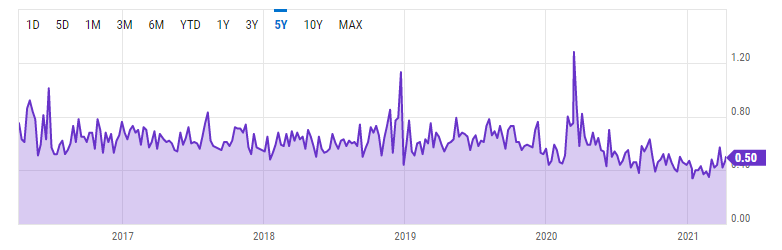 Source: Ycharts
Another aspect that reinforces the extreme bullishness is - the fact that some of the most renowned funds focused on shorting stocks have seen their AUM declined considerably, according to Institutional Investor. Kynikos Associates led by Jim Chanos, the most renowned short-seller saw their AUM decline to $405M from around $932M. Sophos launched in 2020 with $1.16B AUM and ended the year with $258M. Although it is imperceptible if some of the declines can be attributed to negative returns or redemptions. It is fair to assume at this point that investors’ that were previously bearish are now turning bullish.
Systemic Risk
We have recently seen how excessive leverage poses a systematic risk and increases the chances of a market correction. The apparently small family office of Archegos Capital showed how fragile the system really is. Tail risk should not be ignored at this point. It took just a few stocks plummeting to completely wipe out Archegos Capital lost $20B in just two days.
There were several banks affected by the losses, most notably Credit Suisse (SWX: CSGN) whose stock price collapsed after the reported losses. Recent reports show that Credit Suisse might consider divesting its fund management segment, following the collapse of Archegos Capital.
VIX
The CBOE volatility index has been in decline and reaching one-year lows. What is probably the best market indicator for volatility has finally reached the teens. Volatility expectations are the lowest since COVID-19 decimated the market nearly a year ago in March 2020. Although most investors are not betting on increased volatility in the short term, it does not mean that it will not happen.
Bloomberg has recently reported on a massive VIX trade. A total of 200,000 contracts were transacted. According to Bloomberg, the settled price was $3.4 for the calls with a strike price of 25. Apparently, the same trader sold calls at a strike price of 40 for $1.3. At this point, it is impossible to determine who is behind the trade, and their intentions. For all, I know it could even be a hedge against long positions. Nonetheless, it appears that the trader behind this massive block purchase of VIX calls is expecting it to stay between 25-40, which signals a potential decline but not a total meltdown like we saw in March 2020, when the VIX reached over 80.
No More Tailwinds
The level of optimism is so high at this point, that news that would usually make the market go down has the exact opposite reaction. Let’s take for instance the recent news regarding the corporate tax rate. If companies are expected to pay higher taxes, then the discount value of their future cash flows will naturally be lower. This has not been reflected in the market and in the price of individual securities. Adding to that the fact that there seems to be a cohort of sorts to try and push corporate tax rates across the Atlantic, it is still to be reflected on European markets as well.
There is more to it, some of the Biden administration's measures like raising the minimum wage to $15/h have not been priced in some securities that are highly dependent on minimum wage workers. Let’s take for instance the example of UNFI (NYSE: UNFI), a company that was previously analyzed here. Although our initial bullish thesis ended up materializing, the company faces a lot of challenges. On one end the large debt loads, that inevitably will take them years to repay, along with the fact that most of their workforce is composed of minimum-wage laborers. UNFI already has razor-thin margins and a large debt load. The increased cost of higher wages is not entirely priced into the stock.
For small businesses, the increased corporate tax rate, along with the higher minimum wage will put some smaller businesses at risk. These tax increases, along with the minimum wage increase are in no way beneficial to stock prices. At this point, there seems to be a lack of news or positive developments that could propel this market to new all-time highs.
Incoming Market Correction
As a value investor, I am constantly trying to look for underpriced securities, and it has been a challenge particularly in the past six months. It does not mean that there aren’t value stocks out there at an attractive price. Or interesting companies, and situations that you can take advantage of. But the fact is that since March 2020, every single stock seems to be highly valued, and at this point, there seems to be more value in going short than in going long. Regression to the mean will eventually kick in. At this point, it seems far riskier to buy ordinary companies at 20x earnings than to try and short some overvalued stocks that will never justify their current valuations.
We are long VIX. Read our disclosure.
Featured image source: Saretsky Report