To make a profit in the world of investing, you must have the technical skill to evaluate market trends. Simply said, predicting how the market will move in the future will assist you in deciding which stock to invest in.
However, what are the things to be aware of, and what are the windows of opportunity that could lead to a prospective market investment? We can help you understand market trends: how to identify and capitalize on trading opportunities in simple words.
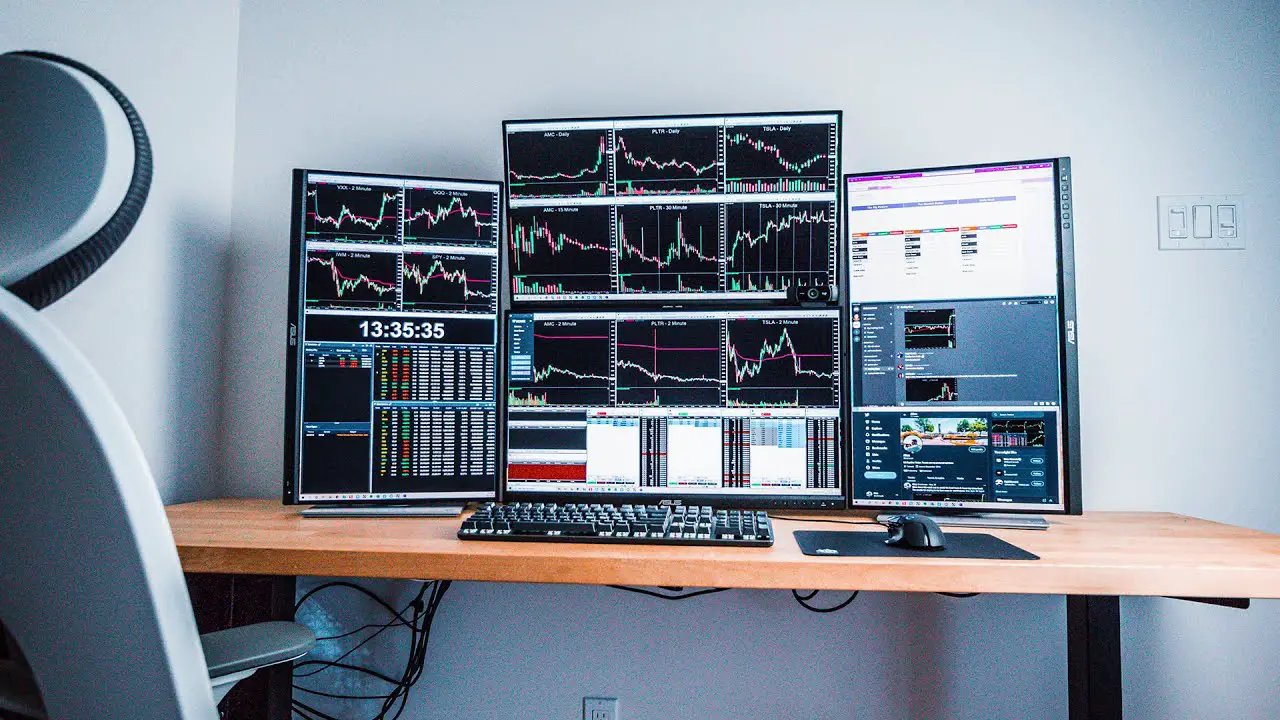
Whether you're a first-time investor or the CEO of a Fortune 500 firm, you can only make the best decisions based on well-informed market data, market research, and analysis.
Identifying the market trend is thus an unavoidable step in seizing good trading opportunities. Read on to learn the criteria to identify the best investment opportunities and the right times to sell.
Access Trading Service Alerts:
Although stock and option investing involves risk, it can be a suitable opportunity for small investors who wants to make a huge profit by investing a small amount of money.
Again, small investors usually don’t have enough time to look for trading opportunities because of their main job responsibilities.
Therefore, to help you with the option of investing, you can take services from a third party. For example, Chuck Hughes Options Trading Alerts can give you weekly and monthly trading recommendations via email alerts.
Since their trading examples simulations are 94.1% accurate, their service is potentially beneficial to achieve investing success.
However, try to invest a small amount of money so that even if you lose, it doesn’t cost you a fortune.
What is Trend Line and How to Use it?
In Technical Analysis of identifying trading opportunities, a trend is the overall direction of the stock market. This direction can be up, down, or sideways.
To analyze, we use the Trend Line that shows the price movement's basic trend and shows whether the trend is going up or down. It's the same as adding a trend line by putting numbers in an Excel report. It shows you whether the overall direction is going up or down.
The trend line is real-time proof that a trend is happening. It is a better method than relying on your emotions or intuition.
Basically, you can find a trend and figure out what it means by connecting a set of highs or lows. This will tell you if the direction is going up, staying the same, or going down.
To understand the profitable trend, you have to look at where a trend line breaks. It is a sign that the trend of a certain market is changing, and it is your time to make a decision whether to buy or sell one.
Uptrend
After adding a number of low points on a chart that slopes up, this is called an uptrend. A trend that is going up always has higher lows and higher highs.
When an uptrend line breaks, you should predict that the trend will either go down or sidelines. So, sell it before facing a loss.
Downtrend
A downtrend shows after connecting a set of high points on a chart that slopes down. There are always lower highs and lower lows during a decline.
When the downtrend line breaks, it gives a buy signal.
Side trend
A sideways trend has no clear direction, but it can be flat with instability. Since the line is unstable, you should wait for a few weeks to predict the pattern of change.
There are two more important ways to use a trend line in trading.
- In an uptrend, one of the most common ways investors follow is to wait until the price reaches the higher low peak and lower trend line before buying. When dealing in the range, traders buy when the price hits support and sell when it hits resistance.
- Utilize the trend line to predict where prices will go in the future and act as a warning system for when a trend might change. You can figure out how prices will move in the future by analyzing both long-term and short-term trends.
Monitor both Economic and National Affairs over News
In order to outsmart your competitors, you must stay updated on top news on trades. In your sector of business, create multiple sources of information to read and absorb all of them, and the more, the better.
In the case of this news, not only the financial news is important but also general news, for example, social, political, upcoming festivals, new trends about any activity, etc.
Even the tiniest activity can leave a huge impact on the stock market and companies. Intelligent investors follow the PESTEL model to figure out which may have an impact on the company in the near future.
PESTEL model stands for the following:
- P for Political: tax and trade issues change after the national budget announcement,
- E for Economic: national factors, for example, inflation, interest rates, and unemployment,
- S for Social: population and health trends,
- T for Technology: availability of devices, automation of jobs and remote workers,
- E for Environment: extreme climate change or pandemic events, for example, flooding or the Covid-19 pandemic,
- L for Legal: sudden changes in employment laws, legal and regulation reformation for industries, for example, garments.
Sort Out Temporary Trends From the Sustainable Movements
Make it a priority to spot fundamental shifts that will inevitably lead to widespread issues that many consumers will be willing to pay to have addressed.
The goal is to get at a business model where revenues are significantly higher than costs over a long time rather than one that barely survives and provides little profit.
Conversations with the problem's potential customers can help you weed out temporary trends. Customers are more willing to pay for a solution when they have been trying to get a profit but failing a few times.
Nevertheless, customers are more willing to invest money in the research and development of solutions in severe instances. Talk to professionals, too. They can't make purchases or cash checks, but they can help clients see problems in ways that no one else has.
Another important aspect you need to keep in mind is that you must control emotions when trading and not make any harsh decisions.
Most of the time, emotional trading leads to loss of investments as people feel fear and greed while trading in such a way. And when these emotions take over one’s mind, they invest without analyzing or doing proper research and make regretful decisions.
What Are the Timeframes of Market Trend?
Before looking for a trading opportunity, you have to understand the timeframes of the market trend. Experts often recommend taking a lesson from the history of a market before investing in it, as the past of a market will help you realize the fluctuations and psychology of any market.
Secular or Long-term market
The market of such a company stays the same for five to ten years, whether it is upward or downward direction. For example, analyze the market trends of Netflix, Google, or Amazon.
These companies show a growth trajectory for the long term because of their increasing customer number, continuous innovation, and staying on top of their competitors in the same sector.
Primary or Medium-term market
The duration of this market is generally one to three years. For example, the Bull market and Bear market.
A bull market refers to the condition when a market follows an upward trend, or prices of assets have risen and are continuing to rise since last year.
Currencies, stocks, bonds, real estate, and commodities are trading examples of a bull market.
On the contrary, a bear market refers to the opposite condition of a bull market. In this condition, 20% or more prices fall and tend to stay the same for more or less than two months.
You can also observe negative investor sentiment and widespread pessimism in such a market.
To invest in such a market, you need to analyze at least the last year’s trend.
Secondary or Short-Term market
Due to any natural calamity or pandemic, the prices of a stock can fall for a few weeks or even months. However, when the situation gets better, the prices may rise again.
If any market follows this trend, that will be the short-term or secondary market.
What Are the Benefits of Identifying Market Trends?
There are three big reasons why it's important for basic analysis to find trends.
- It helps you see the fluctuation in market patterns and frame them quickly and confidently so you can trade based on them.
- Trend recognition tells you if and how you can use trend reversals (changes in trend price direction) to make short-term profits.
- When you know what the market's main trend is, you can draw the levels of support and resistance with more clarity and accuracy and in a way that you can use.
Can Trading Signals Make You Rich?
Do trading signals work? It is controversial whether trading signals, for example, forex signals, work or not. These signals are not 100% reliable as their free and paid subscription shows different result. Therefore, a risky way to invest your money.
Another term associated with trading signals is the pump-and-dump scheme. The trading signal providers buy penny stock with a large amount of money and spread false information to inflate the price of that stock artificially.
Therefore, there are high chances of scams.
Conclusion
We hope we can help you learn how to observe and forecast the market’s potential future. Always remember to analyze and do your own research on market trends to understand their pattern so that you determine which one is a downward and which one is an upward trend.
Since they always evolve and change direction depending on various socio-economical situations, you must make a futuristic decision and take risks when finding a suitable trading option.