
What is a stock reversal? How do you identify it? A reversal is a permanent change in the trend of a stock. Permanent here means that the reversal is not just an instant but lasts long enough in a larger time frame, and today we will look at the best reversal stock patterns so you can identify them for yourself.
Bullish Reversals
What is Bullish Reversal?
Generally, there are two types of reversal; the first is a bullish reversal. Before we explain the bullish reversal, let us first clarify the meaning of the term bullish. Bullish is a stock market term to describe when market participants feel confident or optimistic so that the stock price also increases, and it is expected that the price will continue to rise.
If that's the case, then a bullish reversal is a stock price reversal that was initially bearish to bullish. This bullish reversal shows that the price has reached its lowest point, and it is time to climb up.
Characteristics of Bullish Reversal
A bullish reversal has certain characteristics, and stock will not be said to experience a bullish reversal if it does not meet the following characteristics:
- There is a decline in stock prices for a long period of time, or what we know as a downtrend
- There is a bullish pattern confirming it such as the morning start or a reversal chart pattern such as the inverted head and shoulders at the end of the trend
- It is better if it is followed by a large buying volume and other supporting indicators showing signs of a bullish reversal
Downtrends must come before any bullish reversals. Then there must be a reversal pattern, and an upward price movement occurs and creates a new structure to confirm the pattern is valid.
Reversals can mean two things: a change in the trend from bearish to bullish or vice versa, a change in the trend from bullish to bullish. It is important that the changes for a long time, for the benchmark timeframe itself, can be daily.
Example Of Bullish Reversal Stock Pattern
Example 1:
To understand this concept in more detail let's look at an example of a bullish reversal pattern on Alibaba stock below:
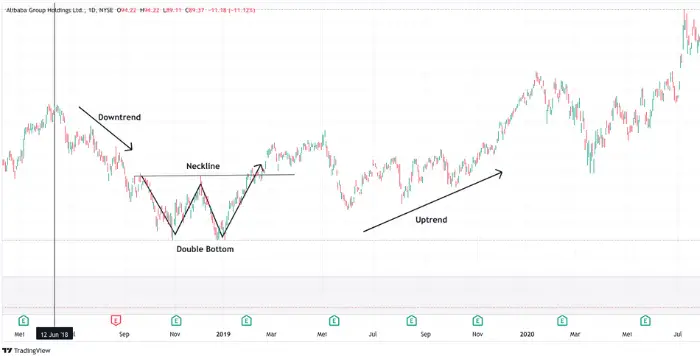
As shown in the picture above, BABA stock could not continue rising and has experienced a downtrend since January 18, 2018. It lasted until September until the price consolidated and formed a reversal chart pattern called the double bottom.
After the price broke through, the resistance became a neckline at the double bottom. Prices have started to increase, creating a new chart structure, an uptrend.
It can be identified by two of the three characteristics of the bullish reversal pattern mentioned earlier. It's even better if you find it along with indicator support.
Example 2:
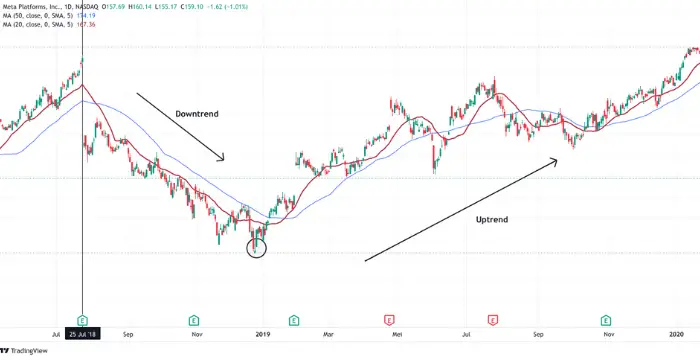
You can see in the second example on META stock. On July 25, 2018, META could not continue its increase and experienced a downward gap. Since then, a downtrend has occurred in meta stocks, where prices cannot continue.
If we zoom closer, we will see a candlestick pattern called an inverted hammer. If previously on Alibaba was a chart pattern, in the meta stock chart image above, the reversal is marked with a candlestick pattern only.
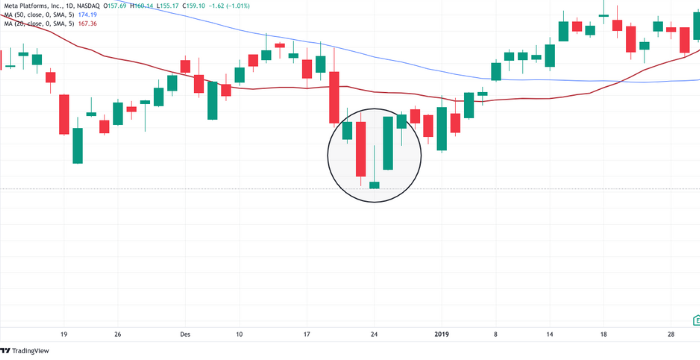
In addition, in this META stock, there is also a Moving Average (MA) indicator that crosses each other, indicating that there will be a significant change in price direction. Thus, the three bullish reversal characteristics above have been successfully fulfilled.
Bearish Reversal
What is Bearish Reversal?
As previously said that there are two types of reversal; the second type of reversal is bearish reversal. Bearish is a condition where market participants feel pessimistic about prices and the outlook for stocks.
So we can interpret that a bearish reversal is a condition where the price changes from the previous up to down because market participants already feel pessimistic.
Characteristics of a bearish reversal stock pattern
Similar to a bullish reversal, a bearish reversal also has characteristics that must be met first:
- There is a significant increase in stock prices before a downtrend occurs
- A reversal pattern indicates that the price is at the end of the uptrend, just like the bullish reversal pattern here can be a chart pattern or a candlestick pattern
- Supported by indicators that indicate that a reversal will occur
A bearish reversal needs an uptrend first until it comes to a point where market participants are already feeling pessimistic about the price, which will usually be reflected in the candlestick pattern or chart pattern and supported by confirmation rather than indicators.
Example Of Bearish Reversal Stock Pattern
Example 1:
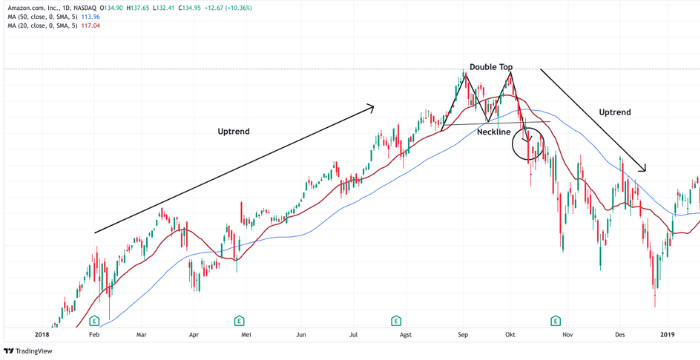
Let’s look at Amazon stock, you can see on September 4, 2018, the stock was unable to continue rising and experienced a momentary decline. After that, the price tried to form a higher high but was unable and instead made a double top chart pattern where at that time, the price broke through the neckline rather than the double top and experienced a reversal.
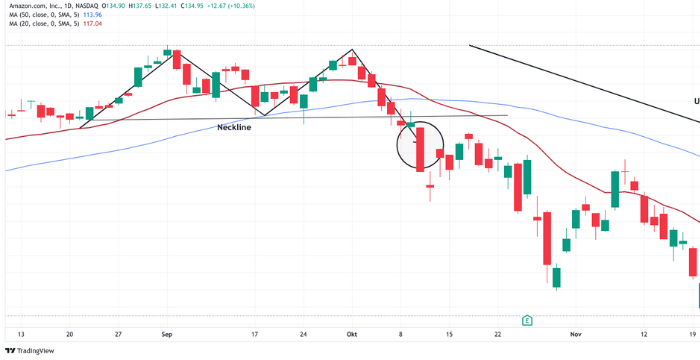
In addition to chart patterns, you can also find a candlestick pattern that is a sign of a valid reversal; that pattern is a marubozu candle. The candle provides data that the seller is in full force and controls the price direction.
There are also indicators in the form of MA 20 and MA 50, which have crossed from top to bottom, showing that the trend will decline.
From this Amazon stock example, you can see a bearish reversal pattern with perfect characteristics. There is an increase; first, there are candlestick patterns and chart patterns, and there is support from indicators that there will be a bearish trend.
How Do You Predict a Stock Reversal?
To predict a stock reversal, an essential thing you need to understand is the characteristics. Logically, if you don't know the characteristics, how can you predict a reversal?
If you understand the characteristics, then there are three methods that you can use to predict stock patterns.
Candlestick Reversal Stock Pattern
The first way is to use a candlestick pattern, which means any type of candlestick that signals us that the price will experience a reversal. There are several types of candlesticks that you should pay attention to, such as:
1. Hammer and Hanging Man
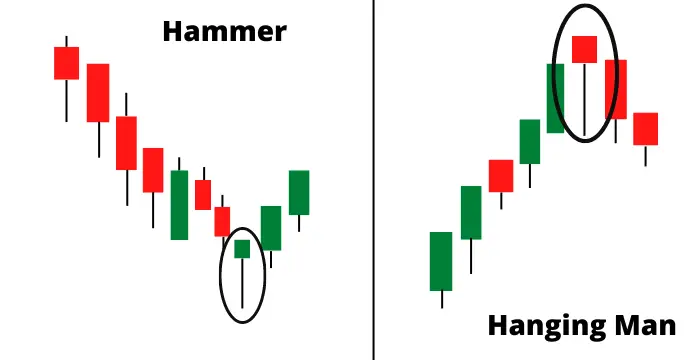
For the first bullish reversal confirmation, there is a hammer called the hammer pattern because it looks like a hammer. When this pattern appears, the downtrend may be nearing its end and will turn into an uptrend.
Meanwhile, in Bearish reversal confirmation, there is what is called the hanging man pattern. The hanging man pattern is the same shape as the hammer pattern. The difference between the two is the condition in which they are. If the hammer pattern is at the end of a downtrend, the hanging man is at the end of an uptrend, and the trend will turn into a downtrend.
2. Bullish and Bearish Engulfing
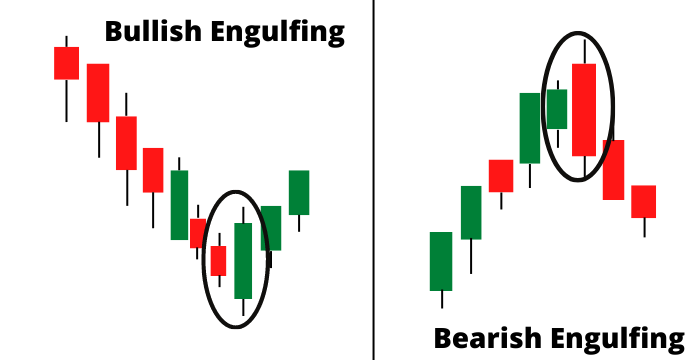
Engulfing is a candle pattern consisting of two candles where one other candle is more dominant than the previous candle. Bullish engulfing, for example, has a form where the body of the bearish candle is covered by one long bullish candle after it. And if this appears, it indicates the price will be uptrend.
For bearish engulfing itself, the principle is the same as that. The shape of the first candle, a bullish candle, will be completely covered by the next candle, which is a very long bearish candle. And if this appears on the chart, then the potential for a downtrend will occur.
3. Dragonfly and Gravestone Doji
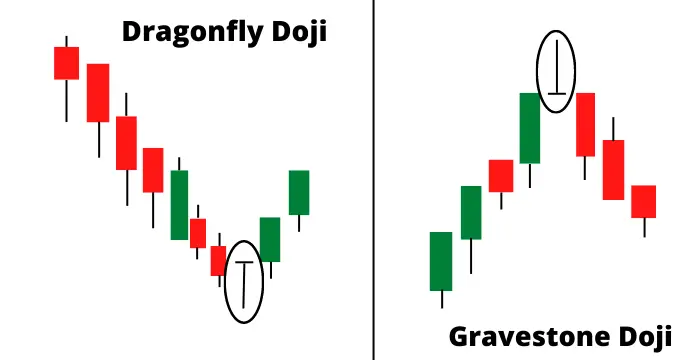
Dragonfly is a bullish reversal pattern called dragonfly because the shape of this candlestick resembles a dragonfly. This pattern begins with a downtrend, and its characteristic is that the shadow or wick is quite long with a slender body.
However, it has no wick at the top and only at the bottom. This is because, at the close of the candle, the buyer's strength suddenly dominates the market and causes a long wick below.
The Gravestone Doji is very similar, it's just that the gravestone pattern occurs in an uptrend, and it doesn't have a wick below it but only at the top.
4. Inverted hammer and shooting star
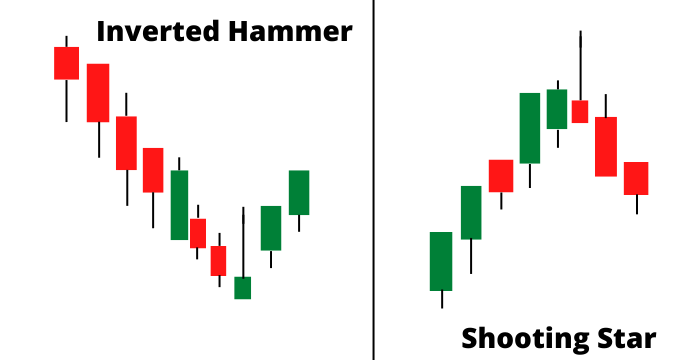
Similar to a hammer, these two patterns are shaped like a hammer, only upside down. For the inverted hammer, you will find it in a downtrend; in this case, the candle can be red (bearish) or green (bullish).
The Inverted hammer signals that a reversal will occur and a change from a downtrend to an uptrend or a bullish reversal will occur.
Similar to the inverted hammer, the shooting star differs only in position. You can find this shooting star in an uptrend because this pattern indicates a bearish reversal.
Chart Patterns
Not only candlestick patterns can be used as a reference to confirm price movements. There is also what is known as a chart pattern; a chart pattern is a price movement pattern that gives a signal that the price will continue to experience a continuation or even experience a reversal. Here are a few of the most frequent stock market reversal chart patterns that you can use.
1. Double Top and Double Bottom
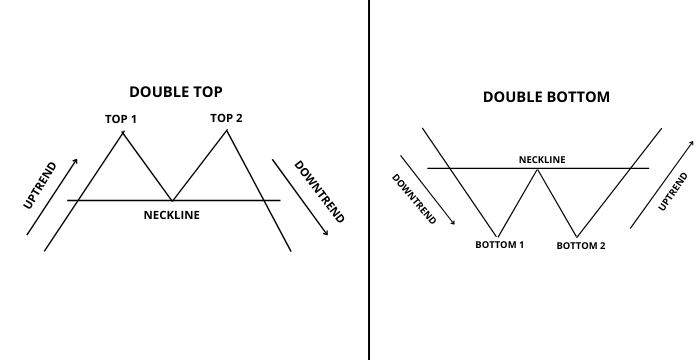
The double top is a chart pattern formed because rising prices can no longer penetrate or make higher peaks than previous peaks, and prices are only stuck at the last peak resistance, and then prices decline.
As opposed to the double top, the double bottom results from a price slide that was halted by resistance and two bounces at the support level, leading to the price experiencing an uptrend.
2. Head and Shoulder/Inverted Head and Shoulder
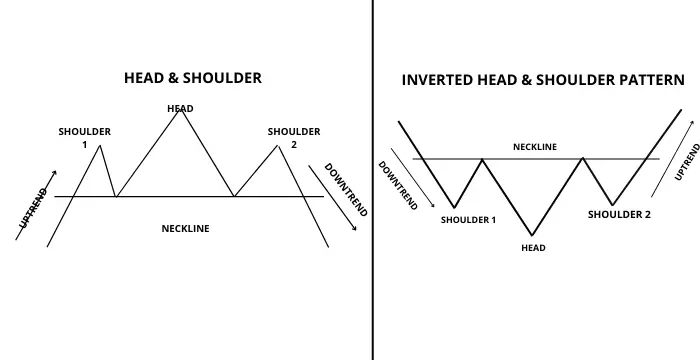
You will find this head and shoulder pattern in stocks with rising price movements. It is named the head and shoulders because it has three peaks resembling the head and shoulders. This pattern signals that a bearish reversal will occur in a stock price.
For the inverted head and shoulder, it's the same way, not the top formed in this pattern but three bottoms which also form like the head and shoulders. You will find it at a price that is in a downtrend. If this pattern appears, there will be a potential for a bullish reversal, and the price will go up
3. Rising and Falling Wedge
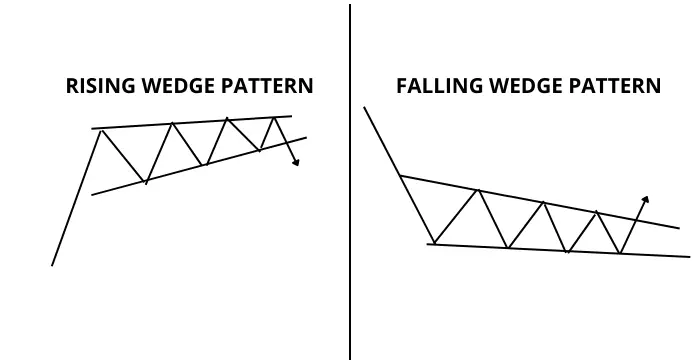
The rising wedge is a chart pattern that indicates a bearish reversal; you will find it in uptrend stocks. In general, you will see price consolidation as if the price was rising. If the trendline support is broken, there is the potential for a downtrend to occur.
The falling wedge itself is a pattern similar to the rising wedge. It's just that the signal given by the falling wedge is a bullish reversal, so when the price breaks through, it will create an uptrend where before, the price was experiencing a downtrend.
Technical Indicators
Identifying stock reversal patterns can also be done using technical indicators. What's that? In short, technical indicators are mathematical formulas that are simplified in graphical form and serve to find out how the market is and help traders to get buy or sell signals.
Therefore, this technical indicator can be used to identify trend reversal. There are a lot of technical indicators, but here are some simple technical indicators that are most commonly used to identify trend reversals.
1. Moving Average (MA)
As you saw earlier in the bullish and bearish examples on META and Amazon stocks, where on the chart, there is one supporting indicator that is used for additional confirmation that the reversal is actual.
The indicator is a moving average or the so-called MA. Moving average is an indicator that measures the average of an asset over a certain period and relates them in the form of a line.
It is also quite simple; you only need to use two moving averages and set their values to MA20 and MA50, then just wait for the MA20 to cross over the MA with a larger value. If it does, it signals the possibility of a bearish reversal if it crosses from top to bottom.
But if it crosses from the bottom up, there will be a potential for a bullish reversal in the stock price.
2. Relative Strength Index (RSI)
An indicator used to determine whether a certain trend has reached the overbought or oversold level is the relative strength index or RSI. This indicator has two benchmark areas: the area of value 70 and 30.
The value of 70 is the overbought point; when the indicator line has reached that value area, there's a chance the price will turn bearish at some point. While the value of 30 is the oversold area, when the indicator line reaches that area, there is a potential for the price to reverse direction or experience a bullish reversal.
3. Moving Average Convergence/ Divergence (MACD)
MACD is indicator traders use to detect anomalies or abnormalities in the market. Yes, stock market price movements can experience abnormalities, namely when prices move against the movement of indicators, which is called divergence.
When the price increases but the MACD indicator actually shows a decline, this is called bearish divergence. This bearish divergence indicates that there will be a bearish reversal in the stock price soon.
There is also a time when the price decreases, but the MACD indicator shows an increase, called a bullish divergence. When a bullish divergence occurs, there is a potential for the price to experience a bullish reversal and an uptrend.